01.1
Download
Select the installation file that matches your operating system. The download button will always link to the latest public version.
- 1Windows selects the .exe file.
- 2Linux picks up the .deb file.
- 3Run the downloaded file and install it.
usix product guide
From the moment you open a file to checking and saving the results, we explain the actual work order.
Axon performs its core analysis on your computer. This manual focuses on the free Axon features, while the paid accounting workflow product Soma is marked separately where applicable.
View the Soma workflow and pilotStart with a DSD file or OpenDART public report.
02Create a reconciliation schedule from the BS and PL, then reconcile it to the ledger and audit report.
03Let's first look at the import and analysis flow in the synthetic ledger video.
04Compare publicly available financial statements from multiple years.
On Linux, analysis functionality is intact, with the only exception being the ability to connect directly to a running Microsoft Excel.
| Features | Windows | Linux |
|---|---|---|
| Audit report verification, ledger analysis, MUS | Supported | Supported |
| Reconciliation schedule creation · ledger and audit report reconciliation | Supported | Supported |
| OpenDART public disclosure inquiry | Supported | Supported |
| MUS ↔ Desktop Excel Live | Supported | — |
| usix-vba Excel Ribbon Add-in | Supported | — |
01
Select the installation file that matches your operating system. The download button will always link to the latest public version.
When you first install Windows, you may see a SmartScreen warning. This message appears because a public code signing certificate is not applied to the current deployment file.
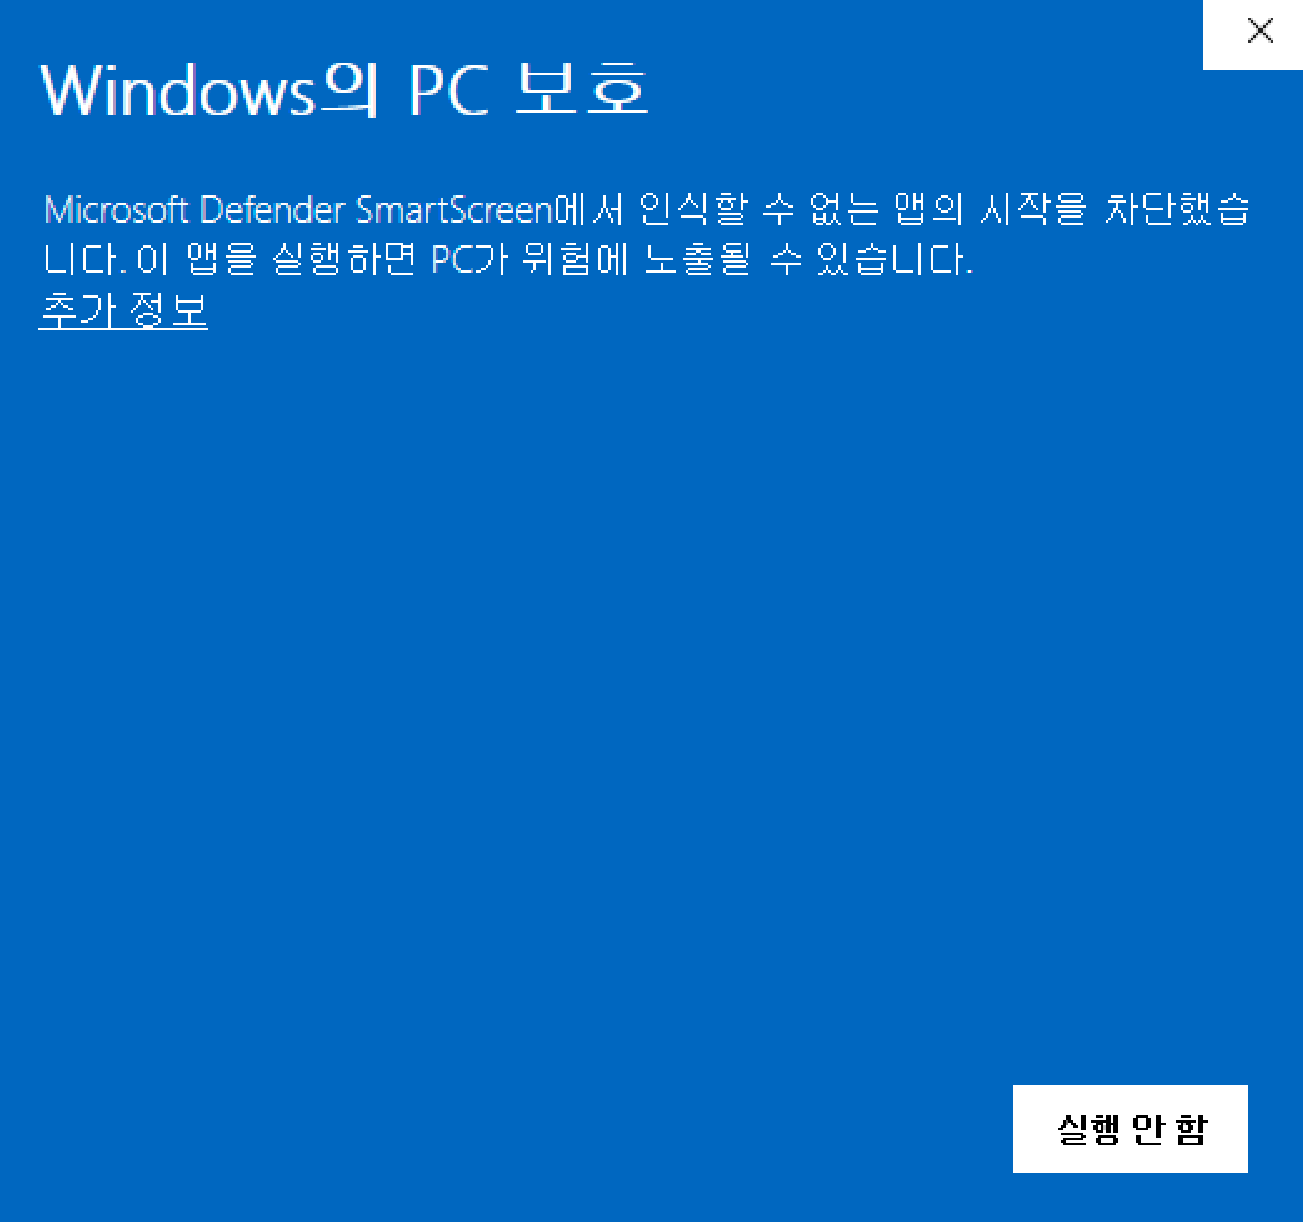
First, check that the file was received from the official download address and that the SHA-256 checksum displayed on the homepage matches. If they match, check the publisher and file name again in 'Additional Information' in SmartScreen and proceed with installation.
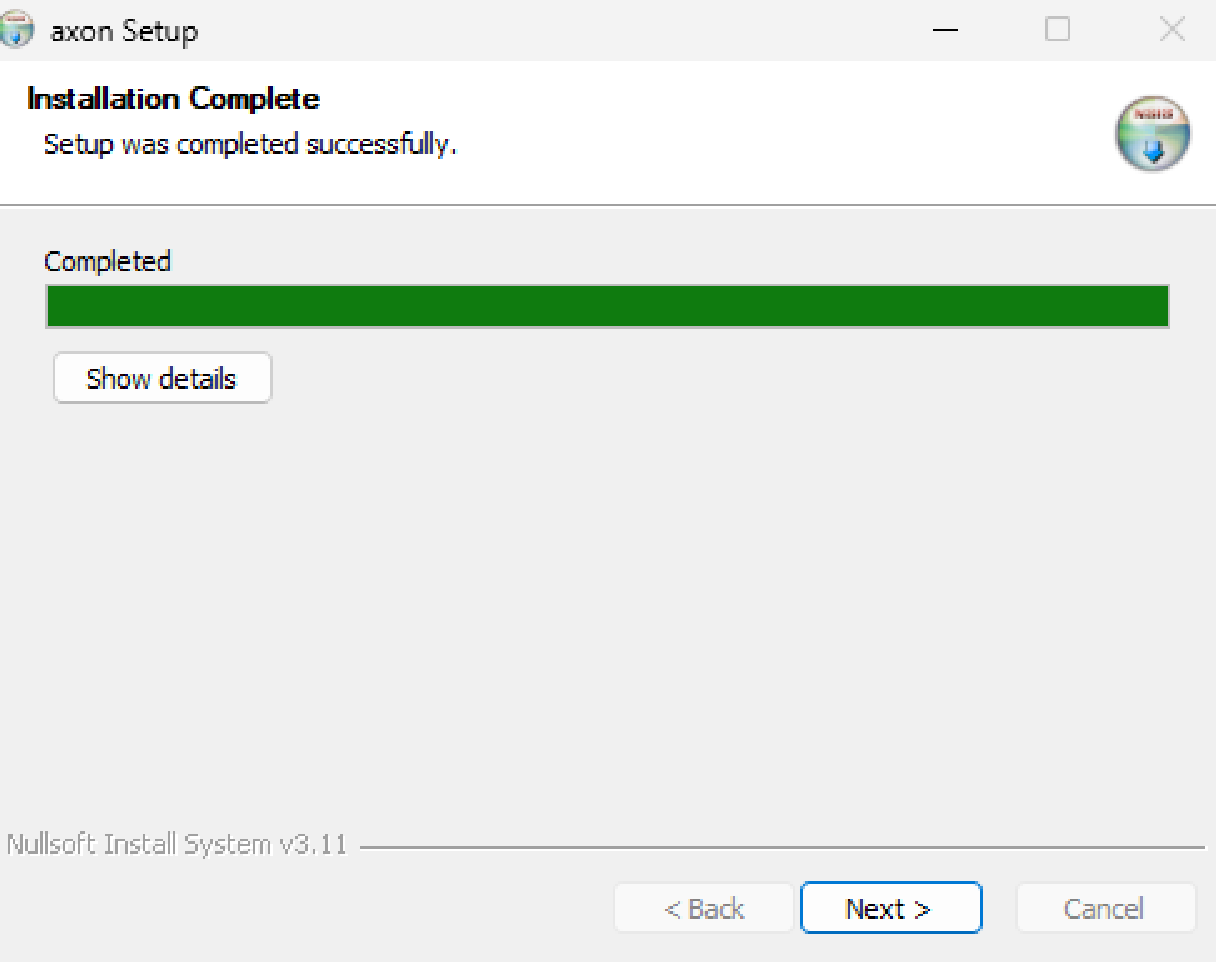
After installation, Axon will run automatically. Afterwards, when you run the program, it will check for new versions and update automatically, so you don't need to install them separately.
02
When you run it for the first time, a terms of use guide will open. After reading and agreeing to the full terms and conditions, you will be taken to the main workspace. Axon is currently in beta, so you'll see a BETA badge in the top left corner of your screen.
In the left function bar, go to Auditing, Internal Accounting, Excel Tools, Help, Settings. The sidebar of the audit workspace contains audit reports, statements/settlement sheets, document/ledger analysis, DART financial statement inquiry, and account area tools. You can expand or collapse the document list or search conditions by pressing the arrow to the left of the item.
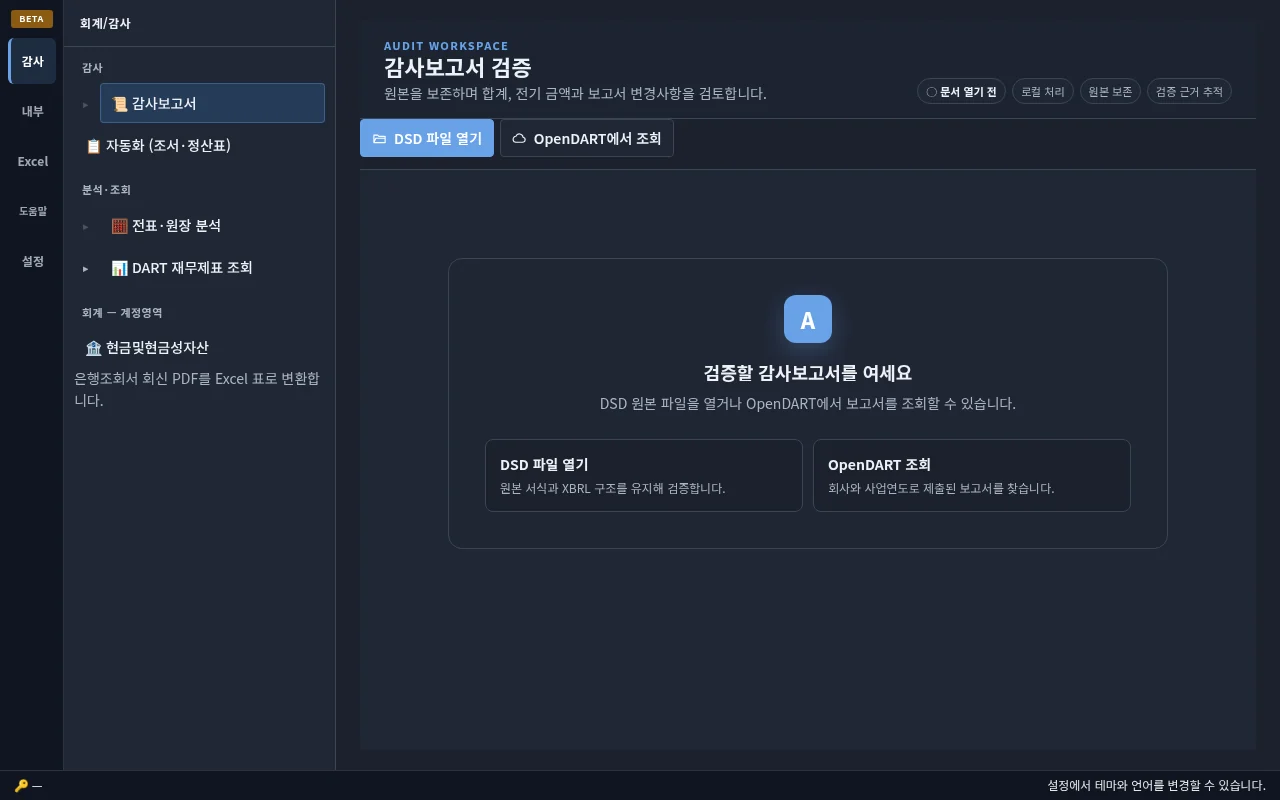
You can check the OpenDART authentication key registration status in the status bar at the bottom of the screen. Change the screen theme, display language, and font size in the 'General' section of settings.
Audit report verification, ledger analysis and MUS sampling are available for Windows and Linux. The Live Roundtrip feature, which connects directly to a running desktop Excel, and the usix-vba Ribbon add-in are Windows-only.
03
You can open archived DSD files or search public audit reports in OpenDART. When you open a report, the financial statement body and notes appear in the document tree on the left.
Recalculate the totals and subtotals displayed in the table to find cells where there are differences. Amounts linked between financial statements, such as cash in the statement of financial position and end-of-period cash in the statement of cash flows, are also compared.
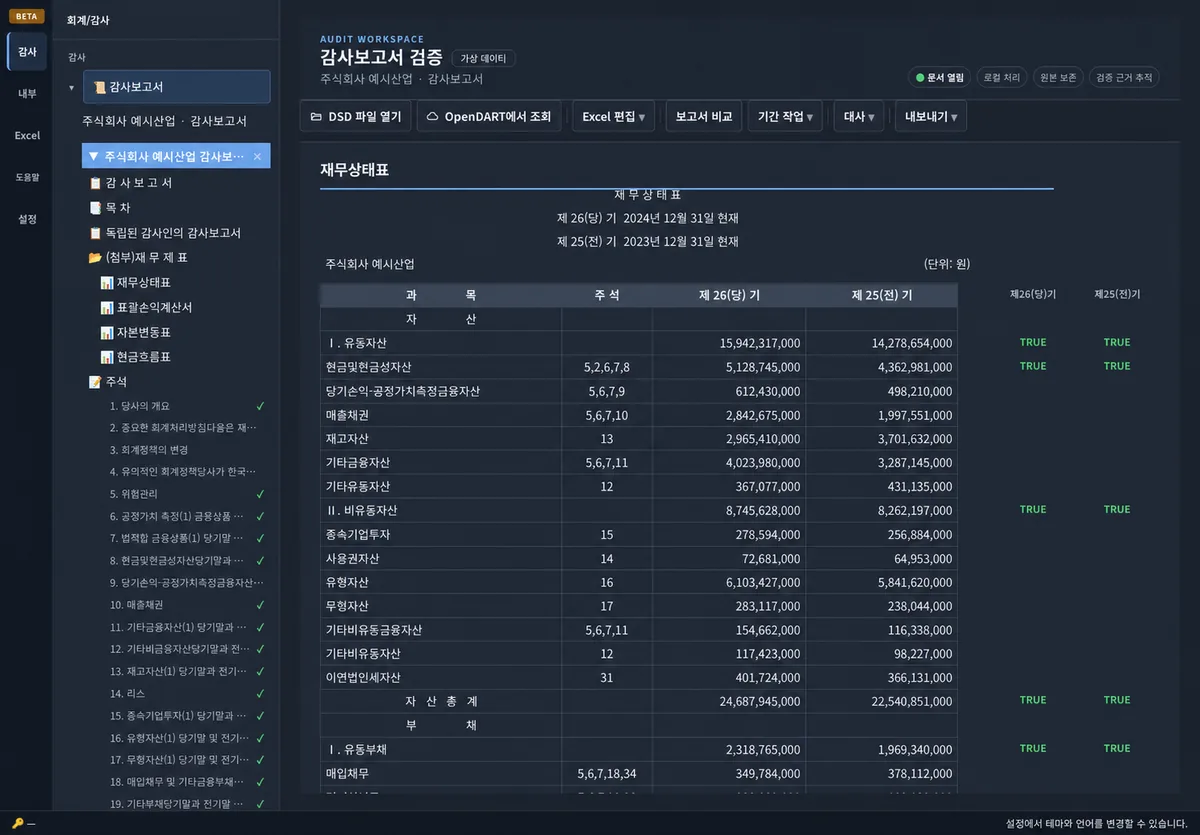
Semi-annual and quarterly audit and review reports are also recognized. The 4-column profit and loss (accumulated basis) and the structure contained in the consolidated and separate files are distinguished and total verification is performed, as well as inter-statement conversion and annotation roll forward (basic → end of the period). The 'Next Quarterly Base Document' creates a framework for the next interim period of the same base, with dates and prose to be checked by the user.
Check whether the amount in the body of the financial statement matches the amount in the notes or other financial statements. It also shows unit differences and rounding differences that occur during the display process.
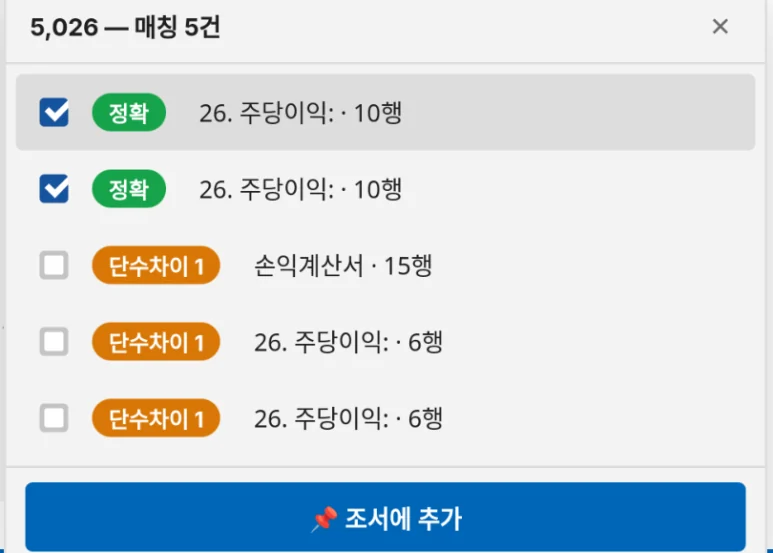
⚖️ Compare two audit reports side by side to see changes, additions, and deletions highlighted in different colors. 📑 Prior-period reconciliation compares the prior-year audit report with the current financial statements, including both the main statements and notes. It can match accounts whose names changed using similarity and amount. The prior-period report is retrieved automatically from OpenDART; if it is unavailable, you can select a .dsd file.

📥 'Carryover from previous period' creates a draft for the next period with the confirmed current period report. Raise all bases in the document by one (27th period → 28th period), and move the amounts from the current period column to the previous column. The values in the statement of changes in capital and notes are also carried forward. Since the new basic amount cannot be known for the roll forward/change/decrease table, the form should be left blank, and descriptive content such as date and audit opinion must be edited manually. The results will open in a new tab without changing the original. It also provides protection against accidental overwriting of drafts with existing data.
Selecting 'Edit with Excel' will open the current report in Excel as it is running. Every time you save (Ctrl+S) in Excel, the changes are reflected on the Axon screen.
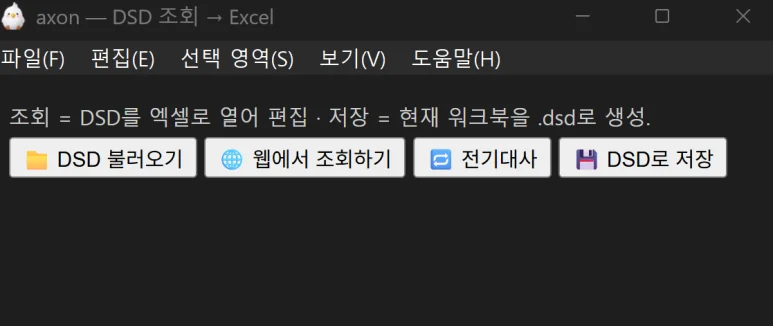
'Import Excel' reflects changes in an external .xlsx file into the current report while preserving the original formatting and XBRL. When you add a row to the table, you are prompted to select an account code (ACODE) from the standard accounting scheme.
When saving in Excel, the financial statements and notes are each created on separate sheets. 'Include putting' saves the sum verification mark together, and 'Exclude putting' saves only the organized results without the verification mark. The current report can be saved again as DSD, and the report comparison results can be exported to Excel or HTML.
04
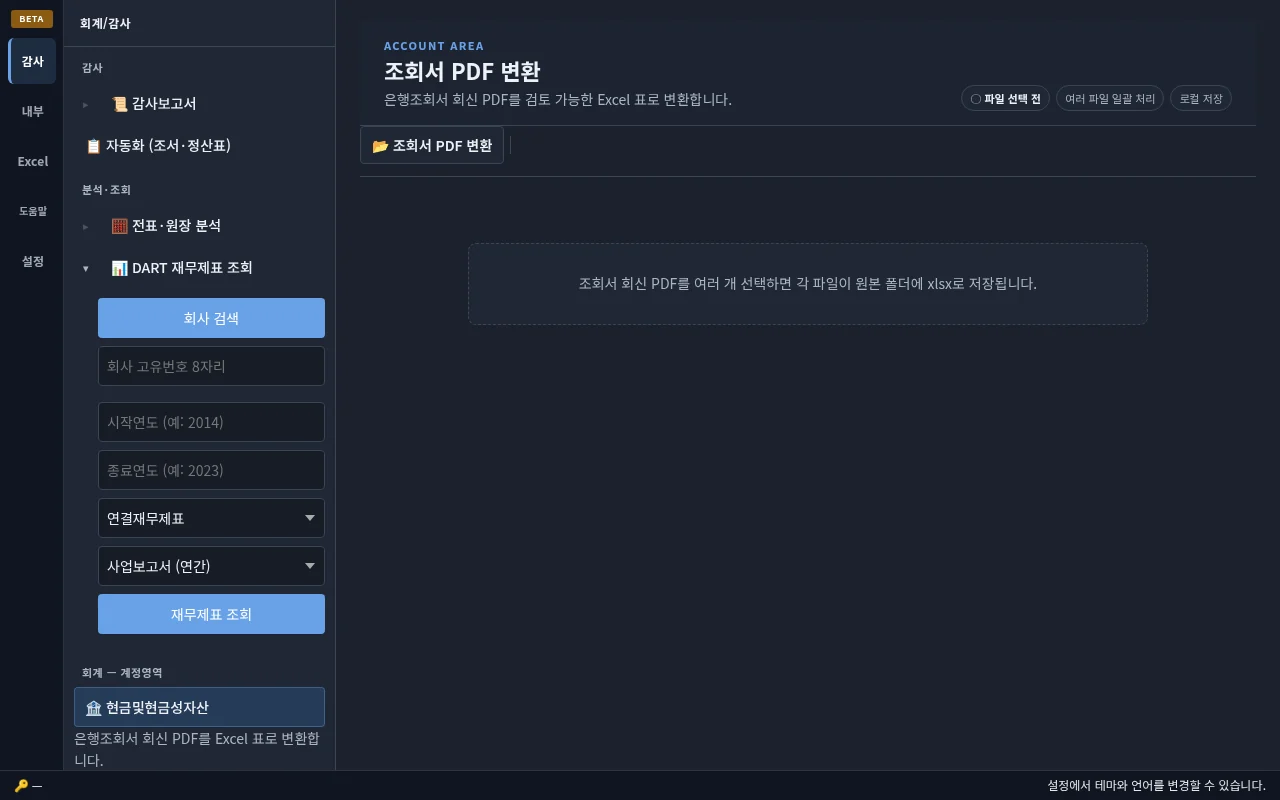
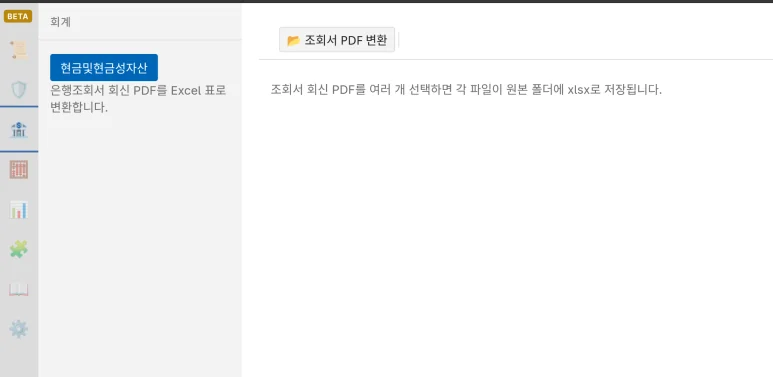
You can convert multiple financial institution inquiry replies to Excel at once by selecting 'Convert Inquiry PDF' in the Account area of the Accounting screen. Digital PDF recognizes the cell structure of tables, and scanned copies and PNG/JPG images are processed through character recognition.
05
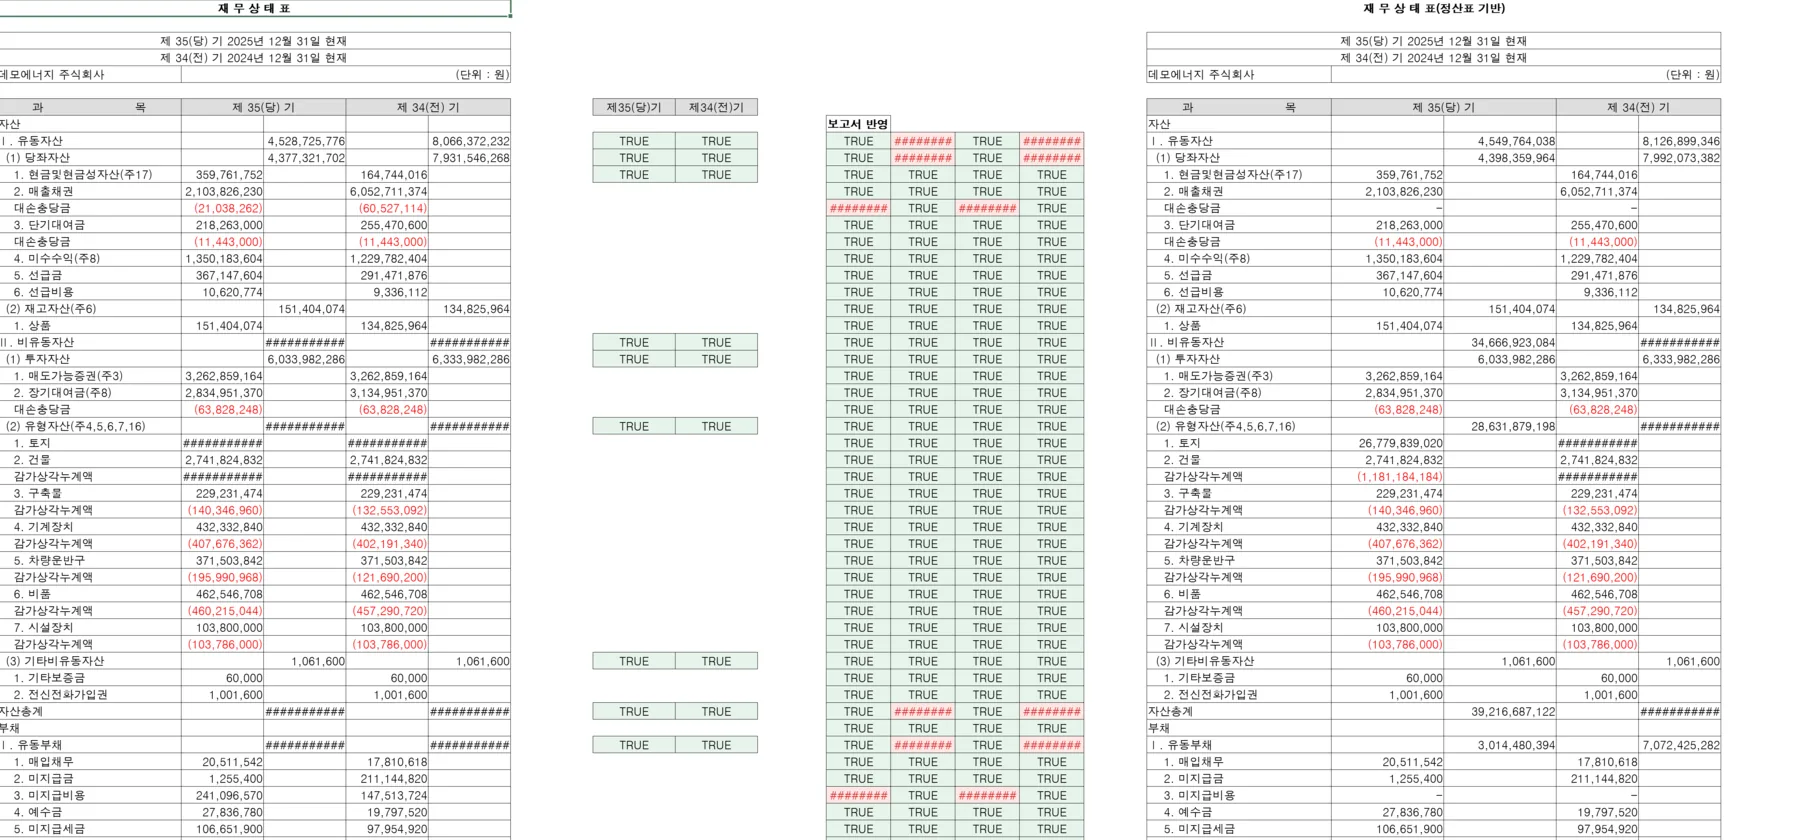
In the Audit workspace, open Reconciliation under Workpapers & Reconciliation and select the company financial statements. Axon reads the balance sheet (BS) and income statement (PL) to create a schedule where you can review current- and prior-period balances and adjustments by account.
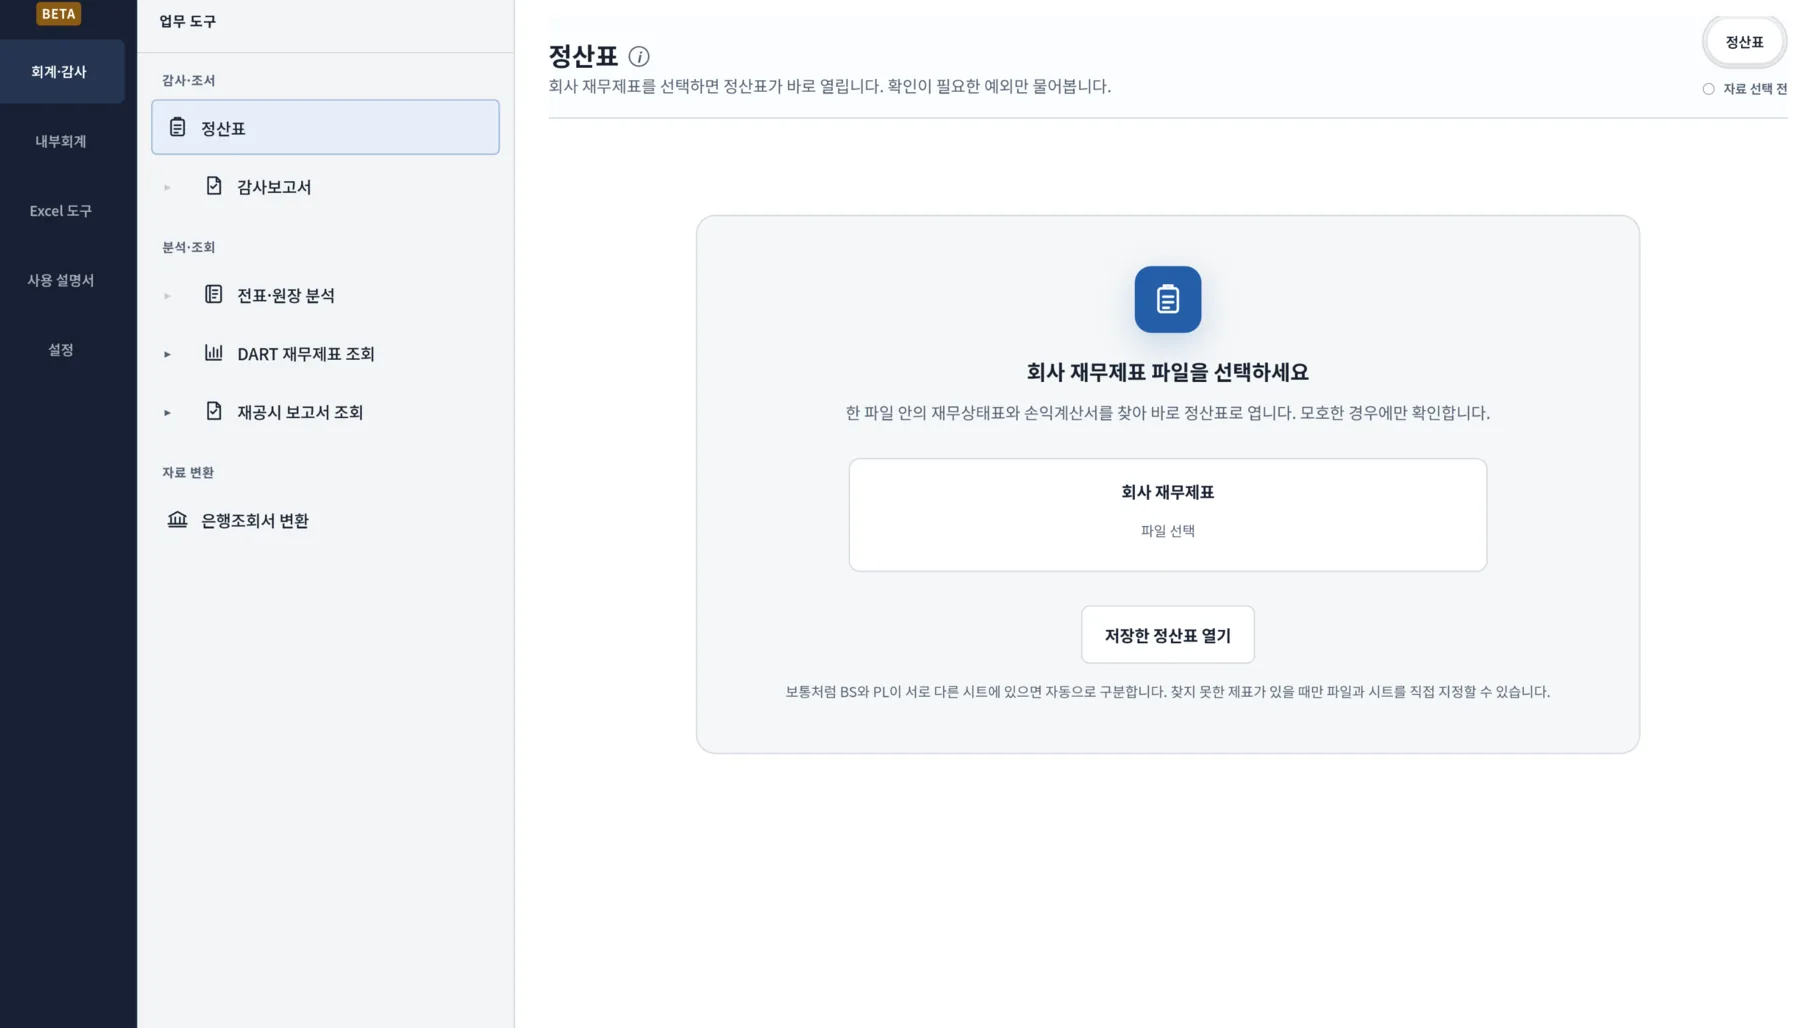
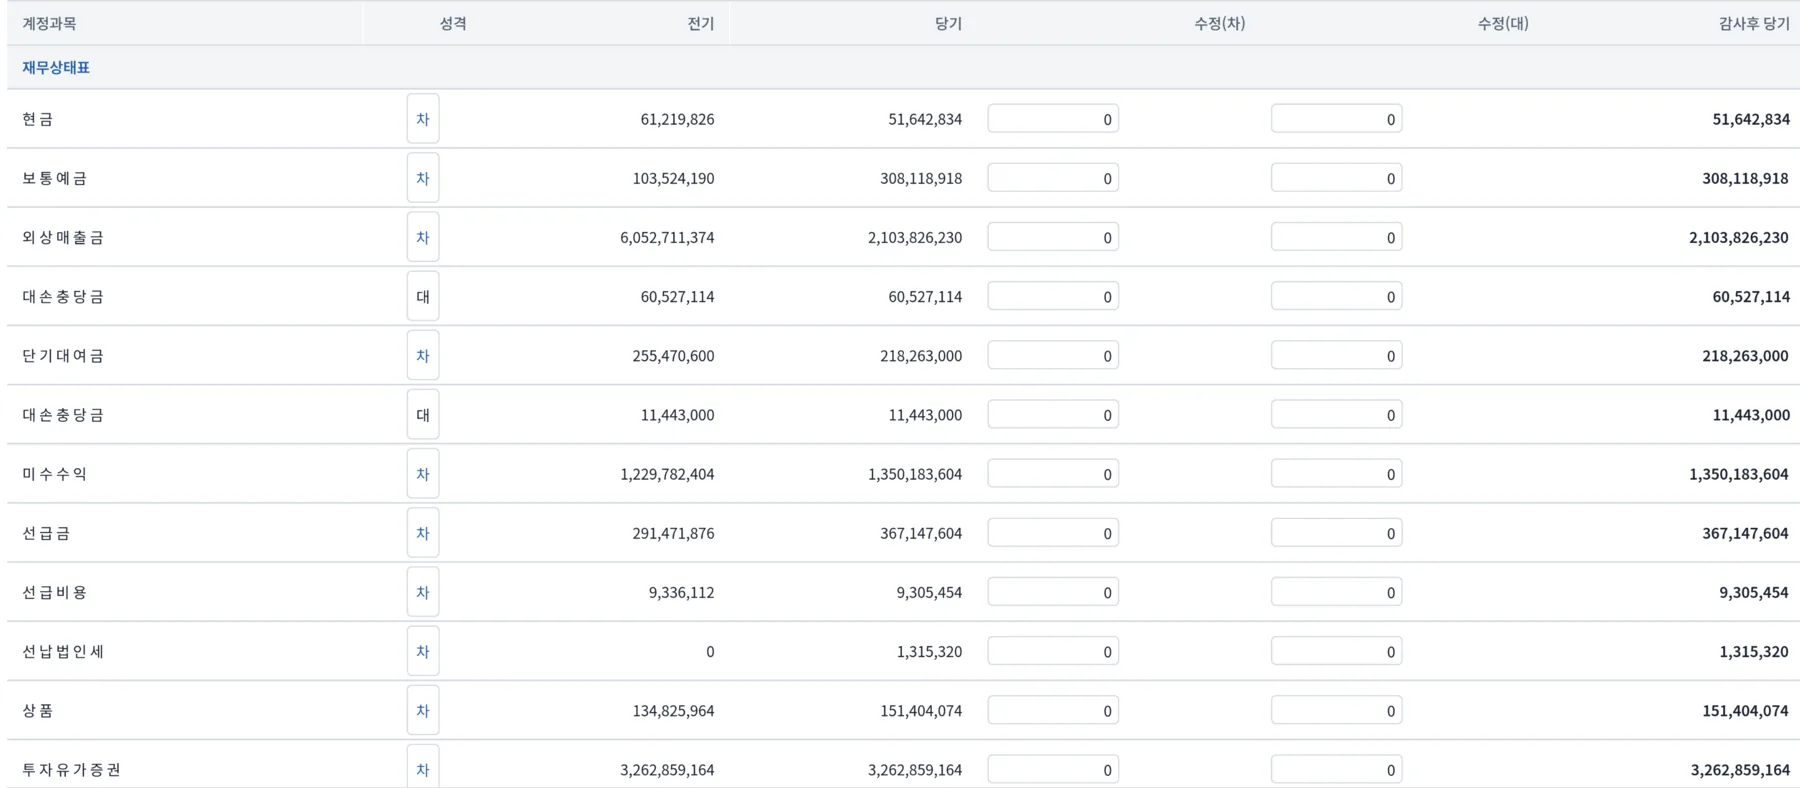
Link a ledger to compare each account's final schedule balance with its ledger balance. Axon shows the match status by account and lets you drill into detailed transactions and journal entries for differences.
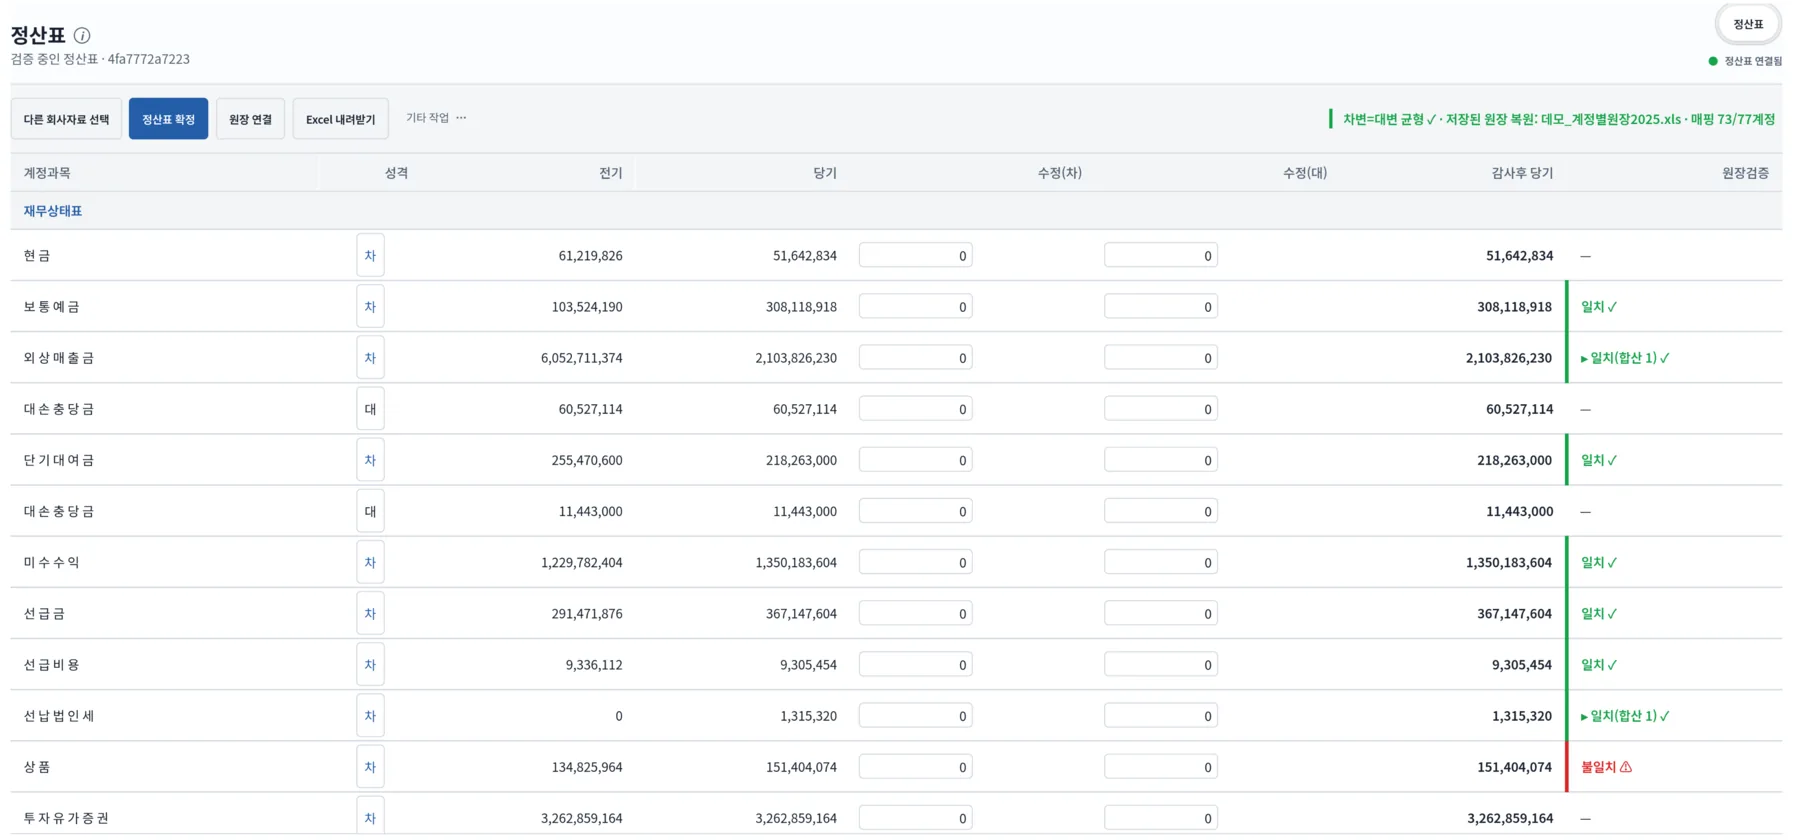
Link an audit report to match report line items with schedule accounts and identify amount differences. When a ledger is also linked, you can trace each difference to its underlying transactions in the same workflow.
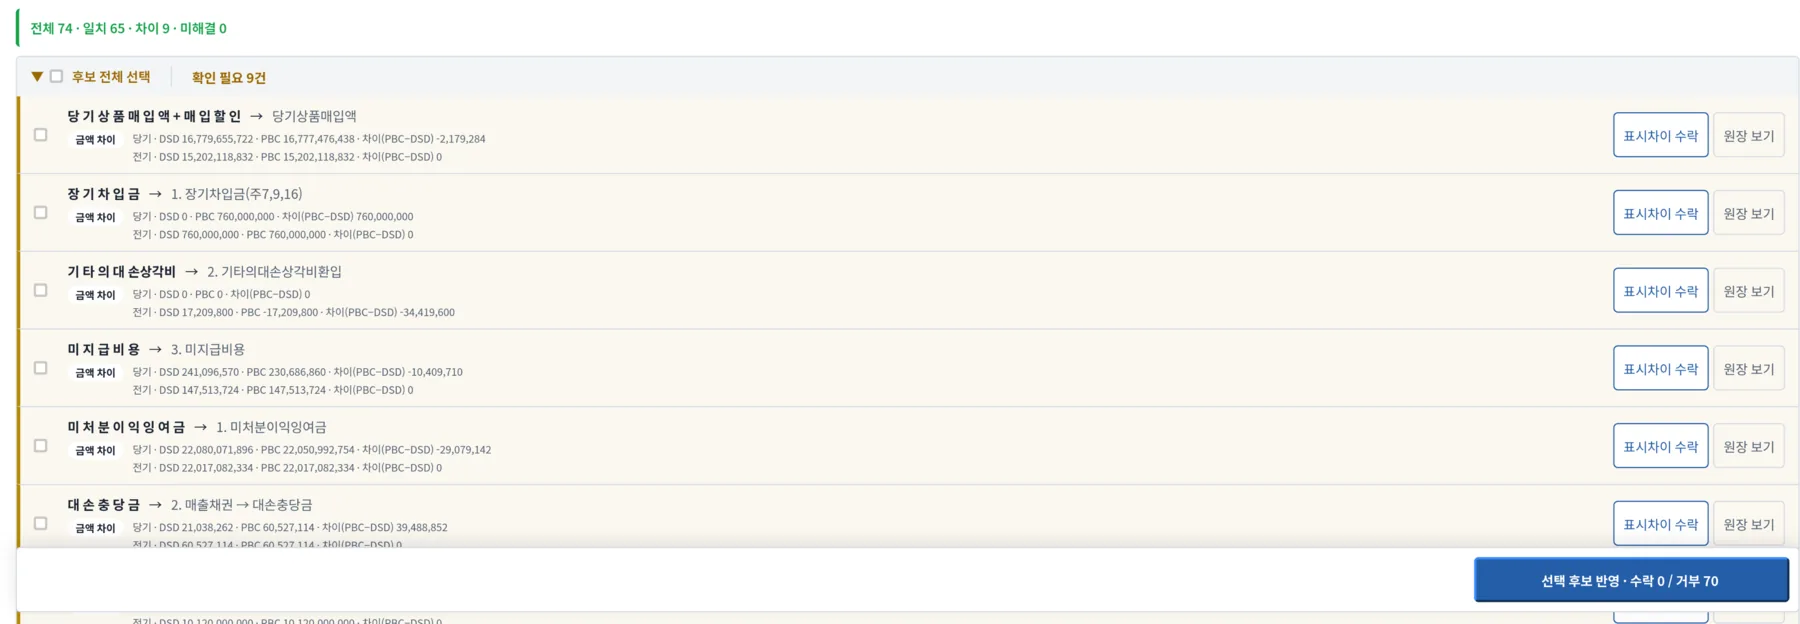
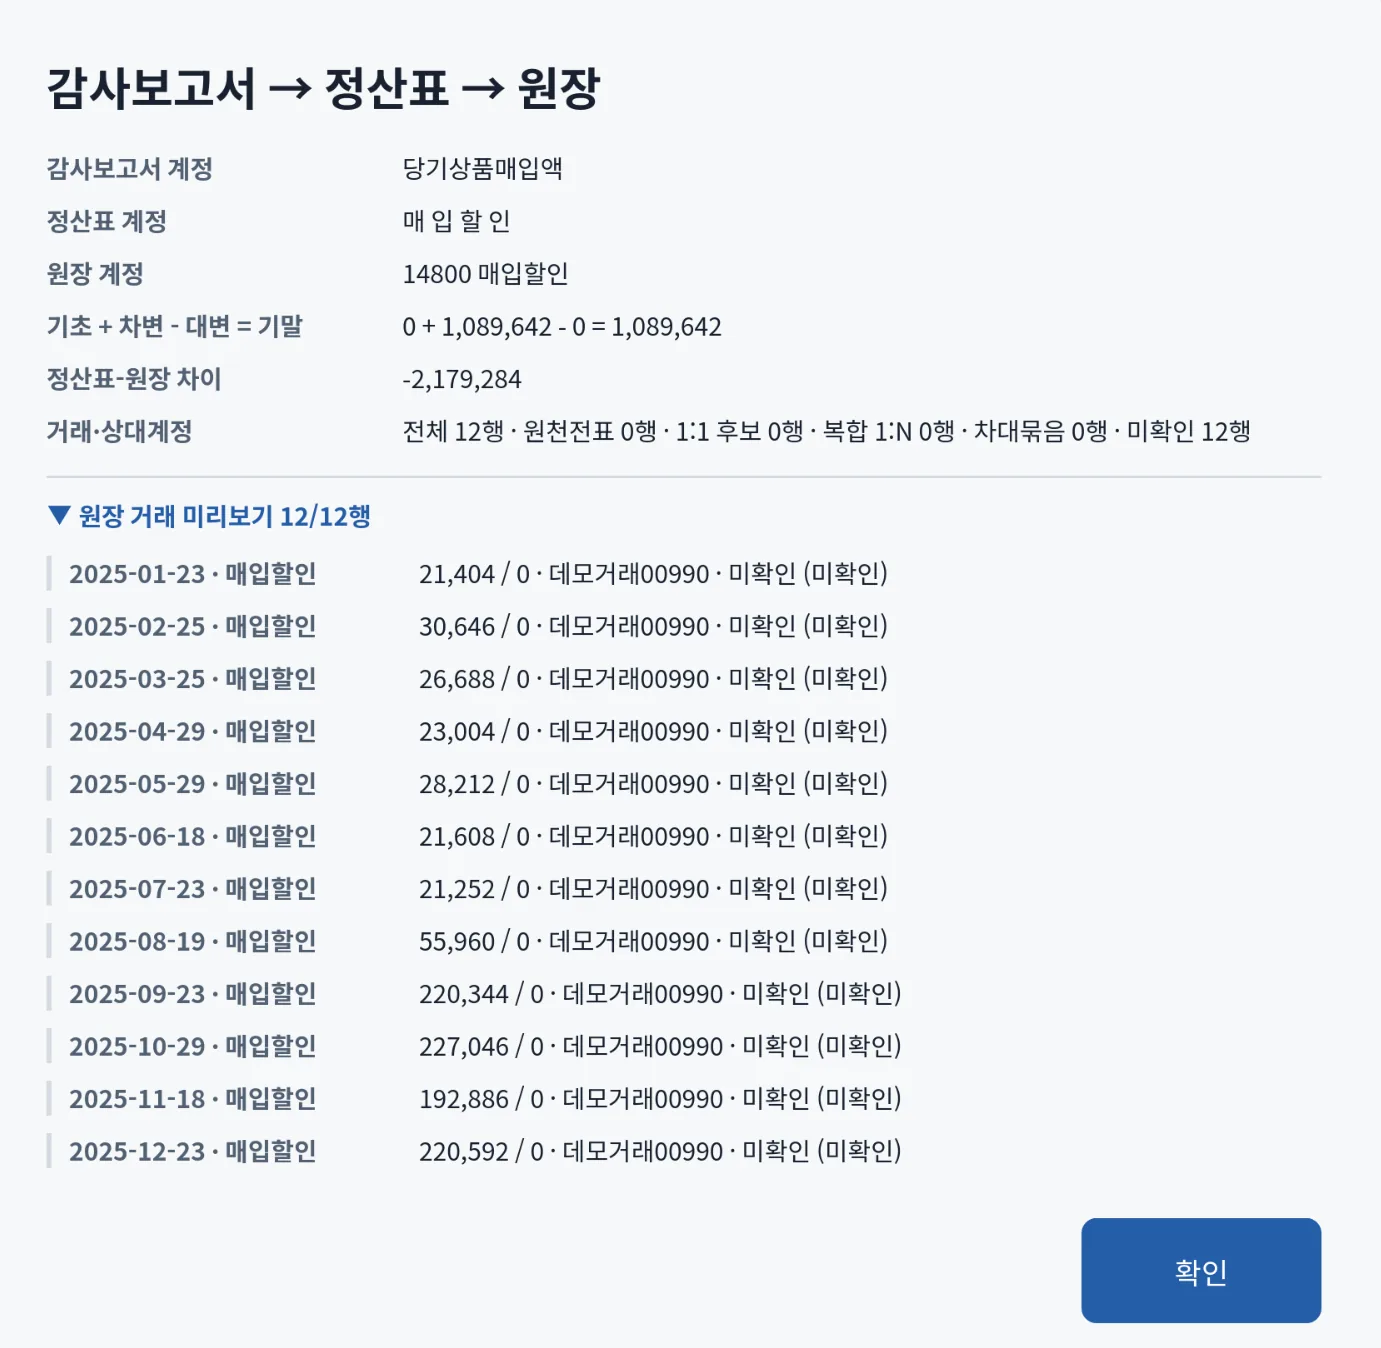
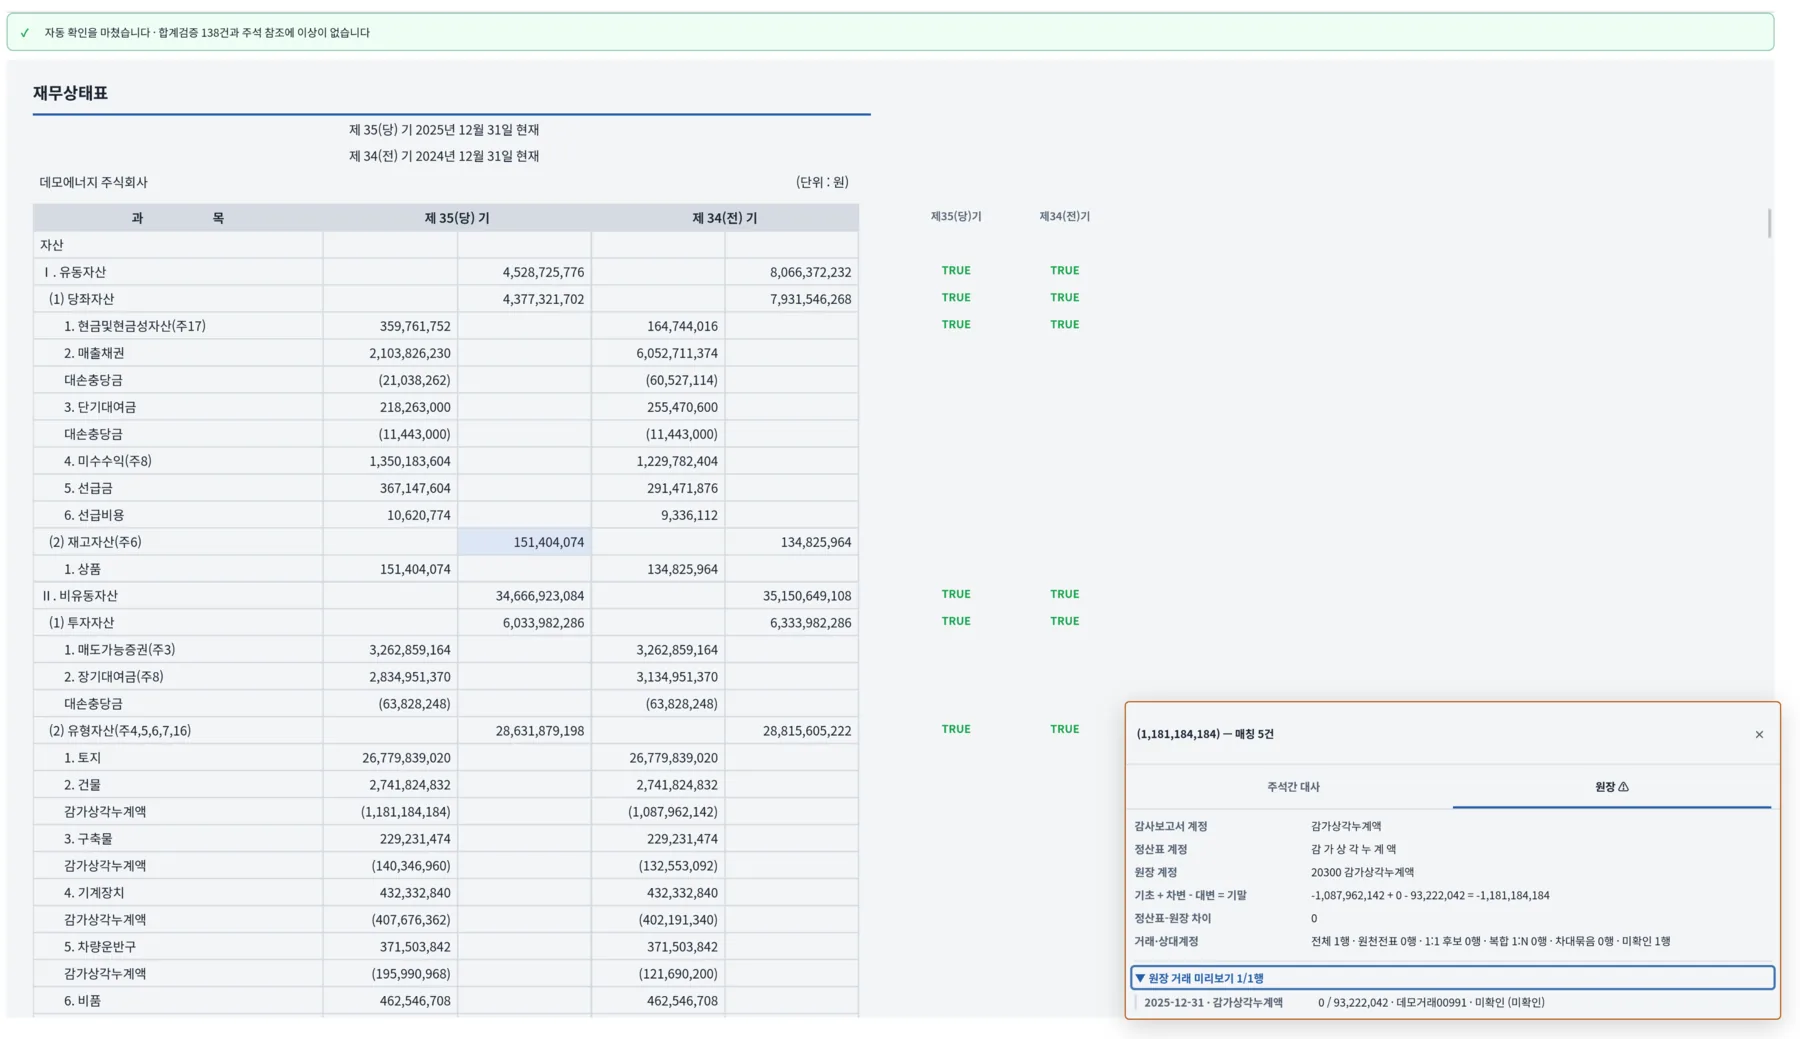
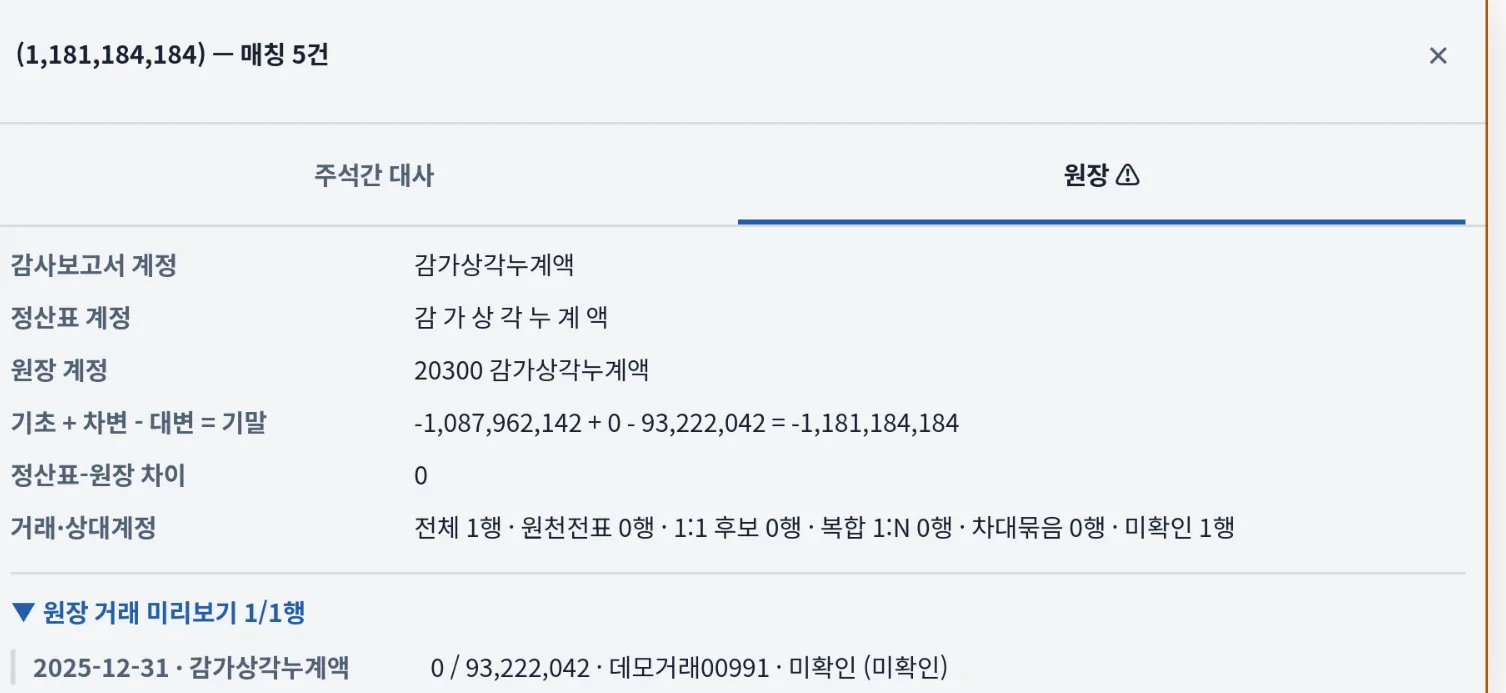
Once the schedule, ledger, and audit report are linked, you can open the related ledger details directly from the audit-report review. Trace a reported amount to its schedule accounts and underlying transactions in either direction.
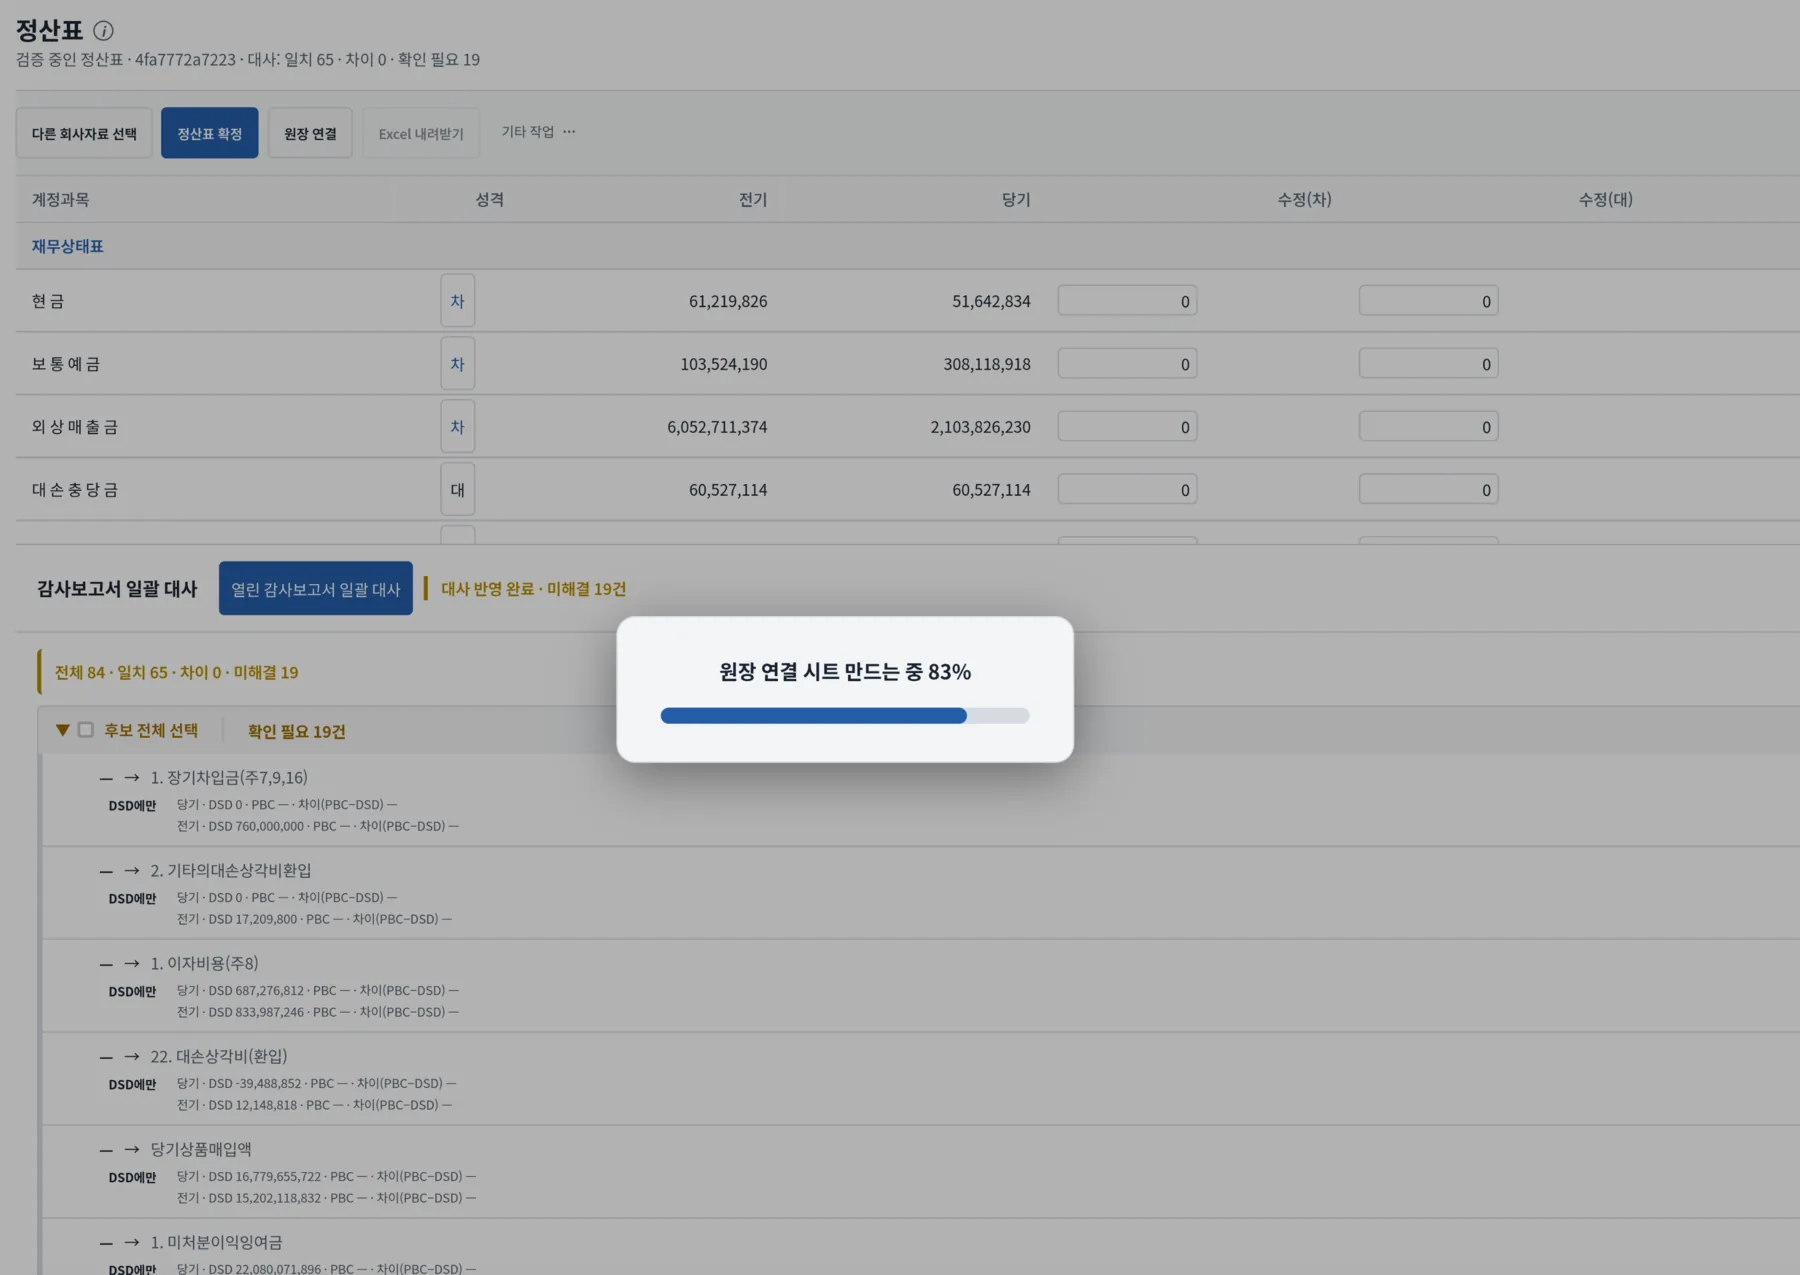
Export the audit-report-to-schedule reconciliation to Excel. Axon shows progress while generating the file, which lists report amounts, schedule amounts, and the match status for each line item.
06
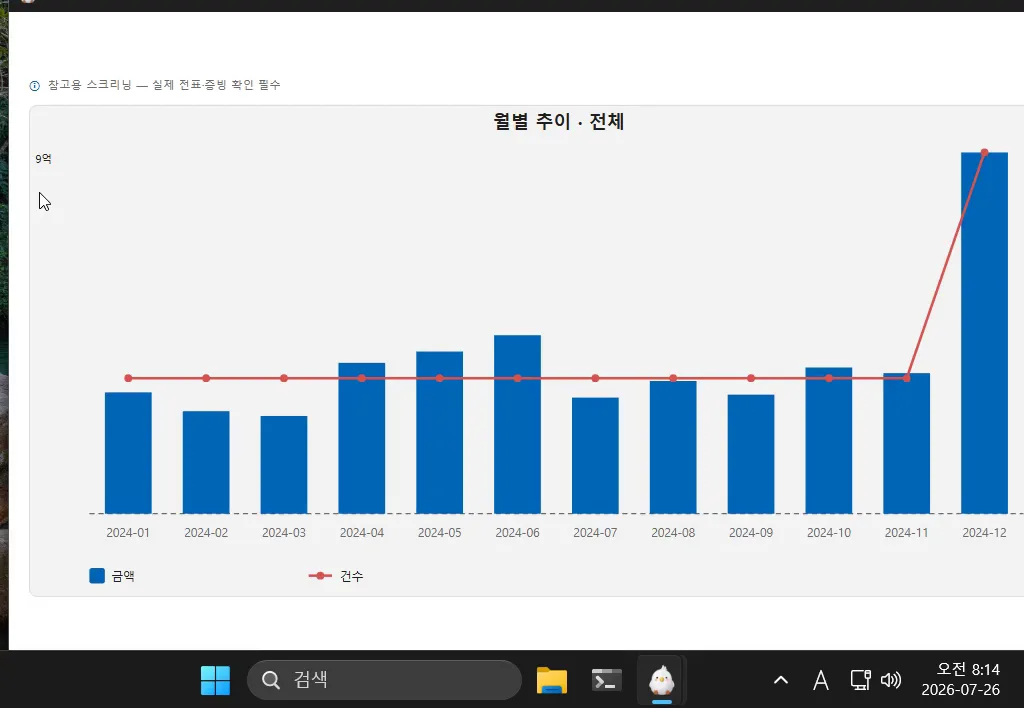
The flow loads 1,640 rows of the fully synthetic ledger, checks the title row, and opens the monthly trend and account Pareto.
Import CSV or Excel ledgers. In the import screen, specify a title row and columns for date, amount, and summary. Files divided by month can be created into one data set by ‘combining and opening multiple ledgers’.
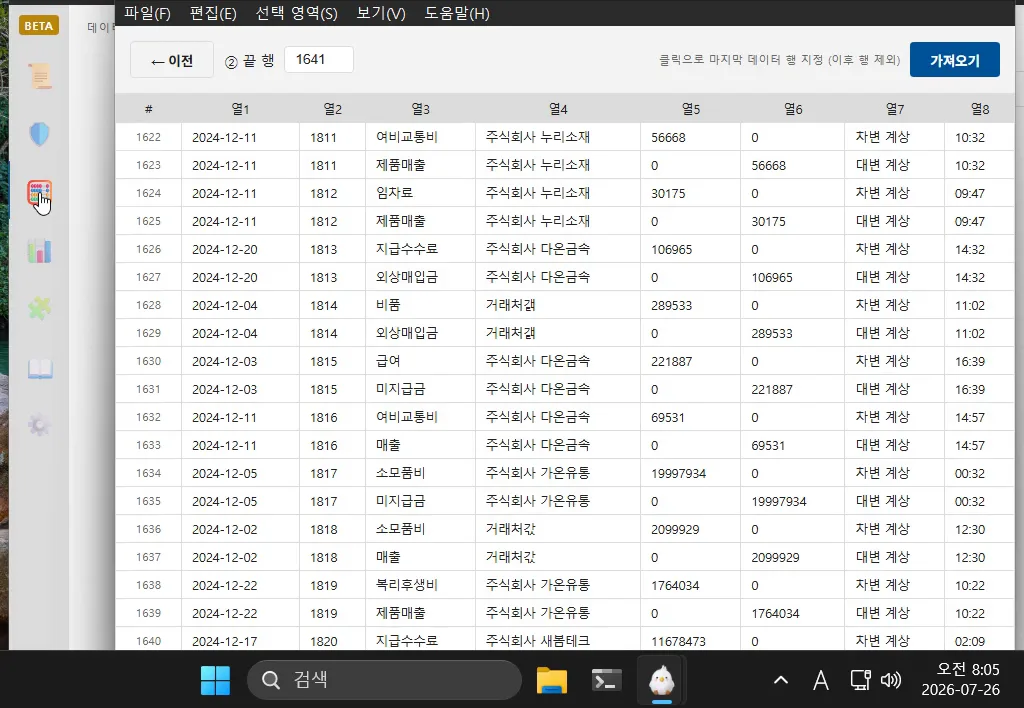
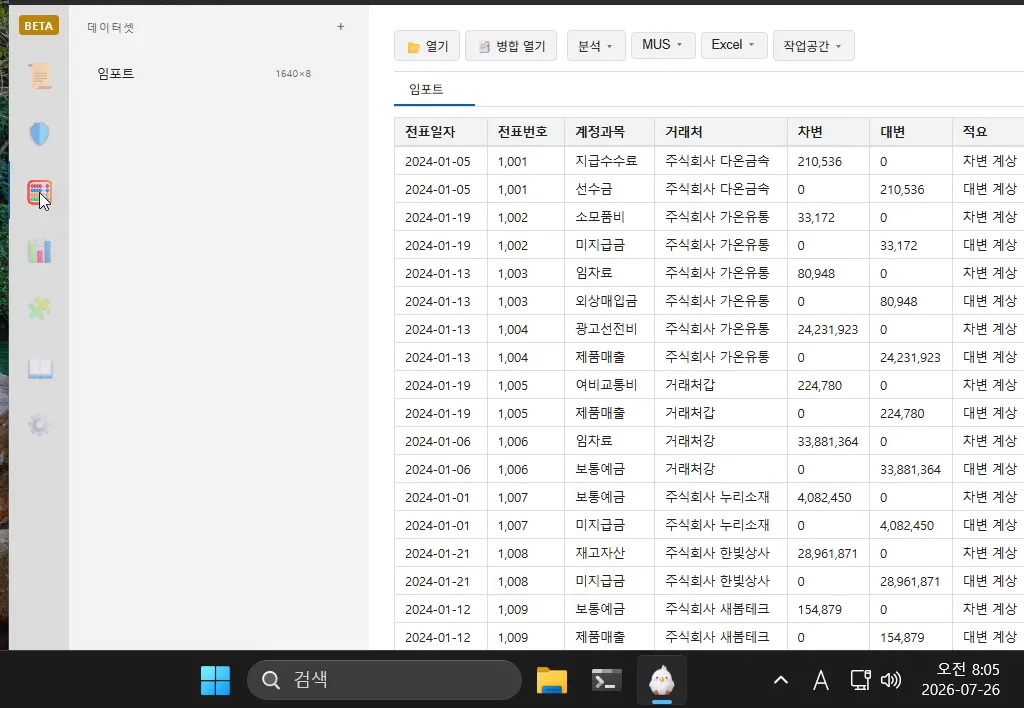
‘Ledger standardization’ organizes the Douzone account-specific ledger (.xls) or ERP ledger (CSV) into a standard table and verifies the totals for each account. If there is no document number in the original, a sequential number is assigned, and the detected form, number of transaction rows, and mismatched accounts can be checked on the results screen.
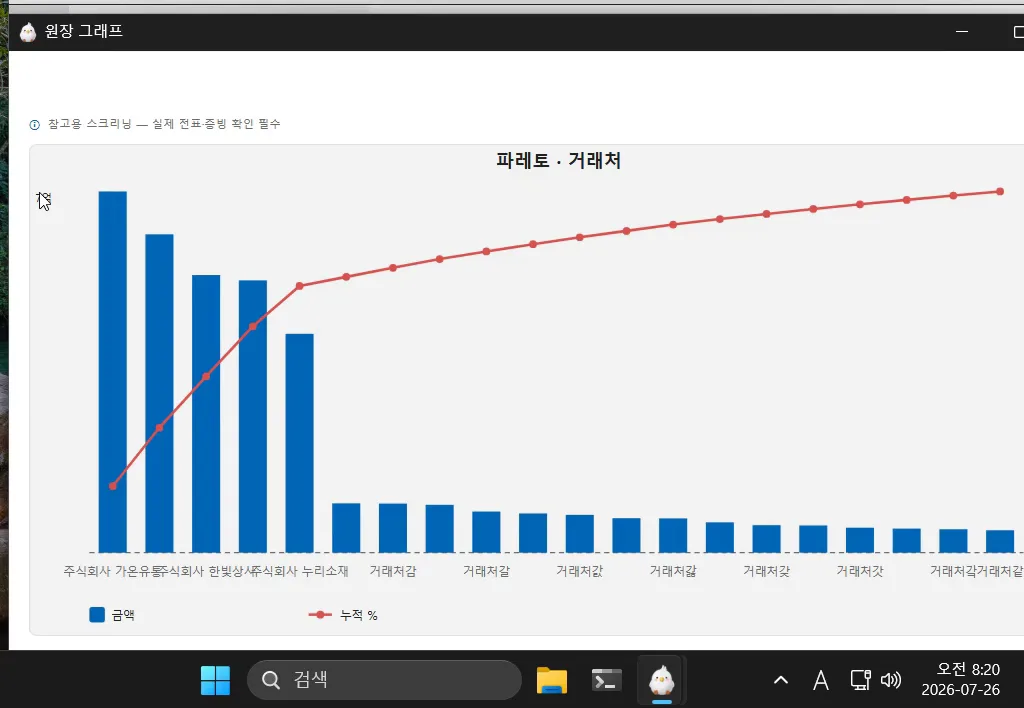
Track original transactions by displaying duplicate values and pivoting, and compare the number and amount of transactions by account in monthly trends. Pareto analysis shows the amount and cumulative ratio for each customer and account.
Compares the first digit of the amount with the expected distribution from Benford's law and looks for transactions with a constant number of ending digits.
Add derived columns such as debit−credit as calculated columns and use them for verification. The calculation results are added to the current workspace and do not change the original file.
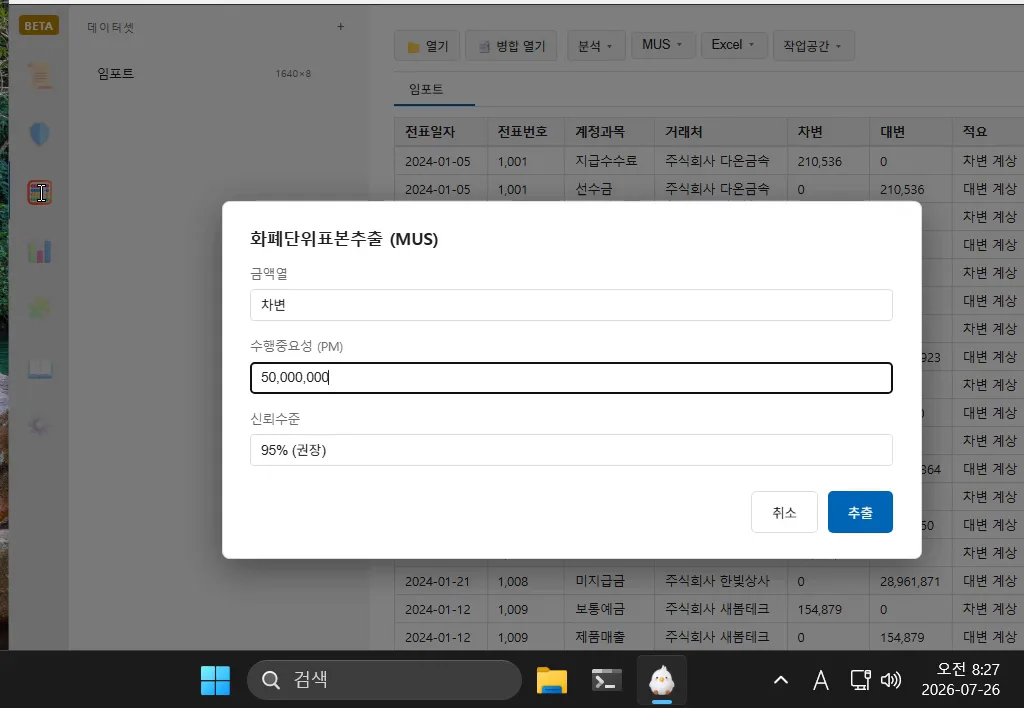
Extract a monetary sample by specifying an amount column, importance amount, and confidence level. Enter the audit confirmation amount of the sample and the upper error limit (UEL) and decision result will be calculated.
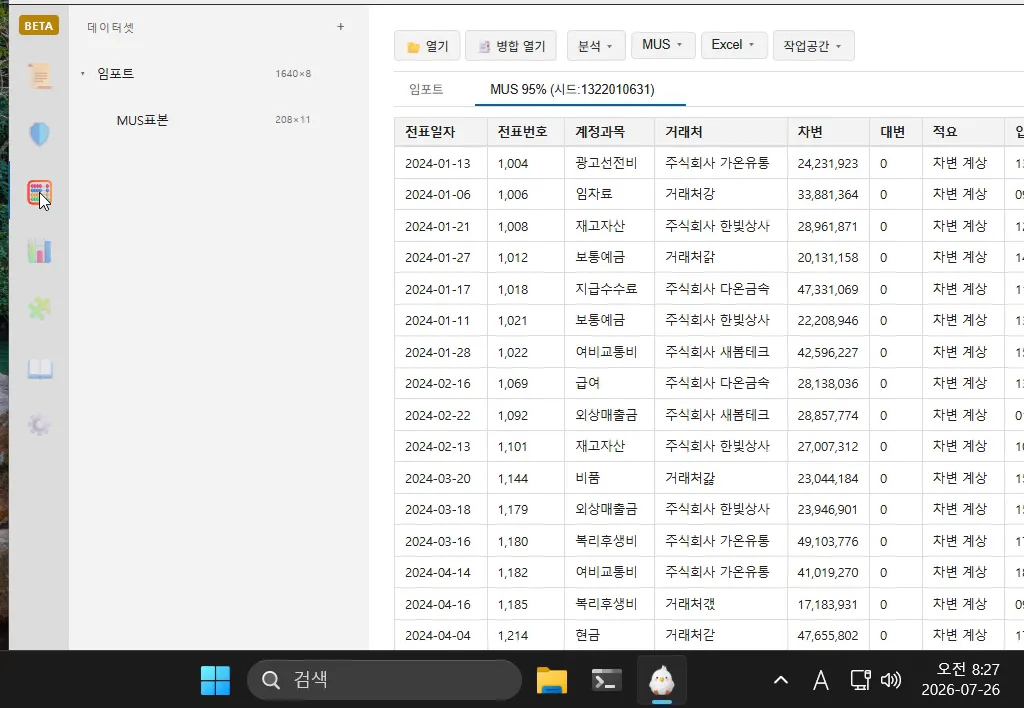
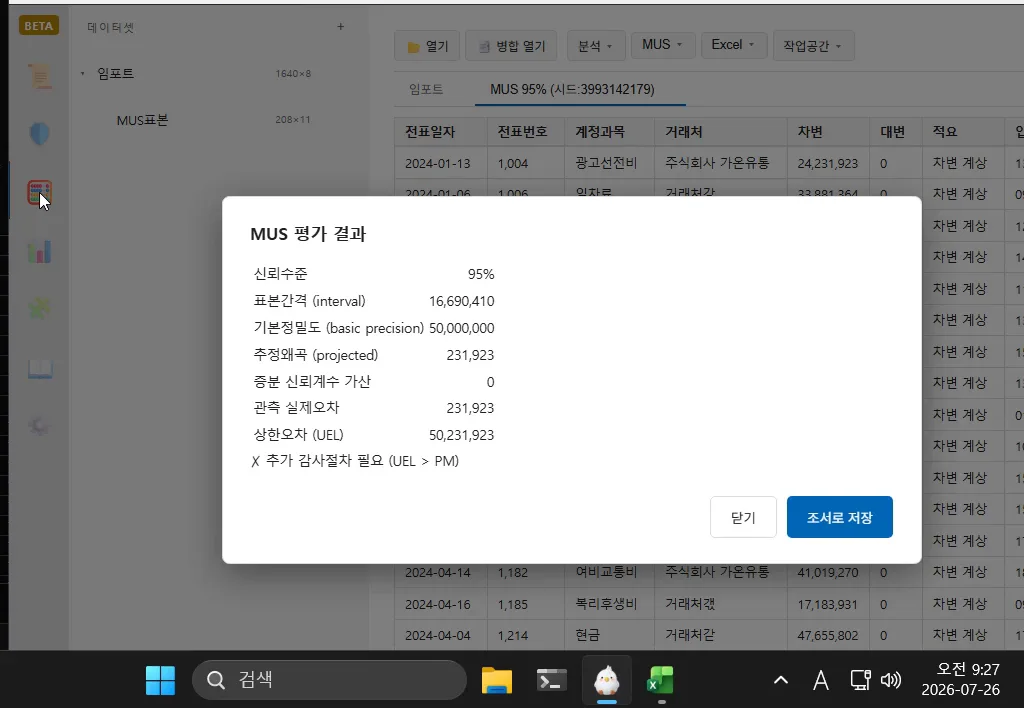
Extracted samples are sent to running Excel, entered with audit confirmation amounts, and returned to Axon for evaluation. The video shows the process of modifying the audit value of the first sample and then reflecting the recovery result in the upper error limit.
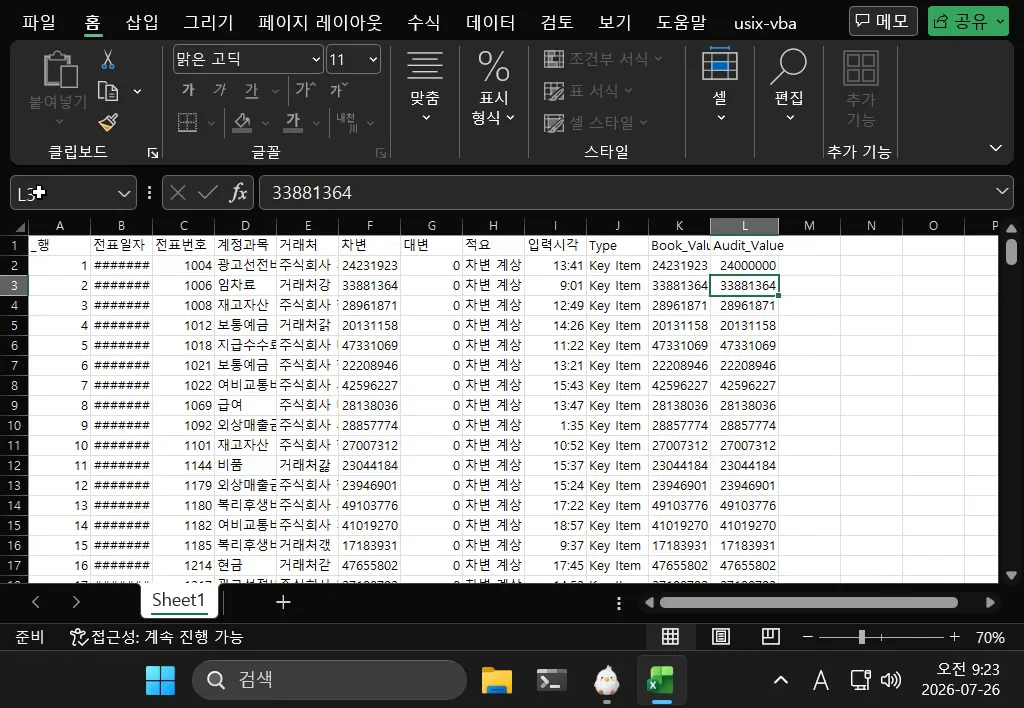
The 'Counterbalance Statement' button analyzes the debit/credit counterpart accounts of a specific account to identify abnormal transaction patterns.
You can save the currently loaded dataset and entire analysis status as multi-sheet Excel, and reopen it later to continue work.
Click ‘Export…’ on the right side of the toolbar. 'Save the analysis results of the current screen as PDF, Excel, or CSV.
07
After registering the OpenDART authentication key in settings, search publicly disclosed financial statements by company name or item code. You can check the query conditions and selected report period on the left side of the screen.
By adding accounts to be compared one by one in the viewed financial statements, you can view amounts from multiple years as a line graph with the same standard.
08
🛡️ Open the .xlsx files of both versions of the Internal Control Statement (RCM) from ‘RCM Version Management’ in the Internal Accounting Dashboard. After specifying the control description column to be compared with the control number column, click 'Compare Differences' to organize the added, deleted, or changed controls. Controls with changed numbers are connected based on the similarity of the content and classified as 'number change', and the similarity standard can be adjusted. Results can be saved in Excel. This is a local feature available for free.
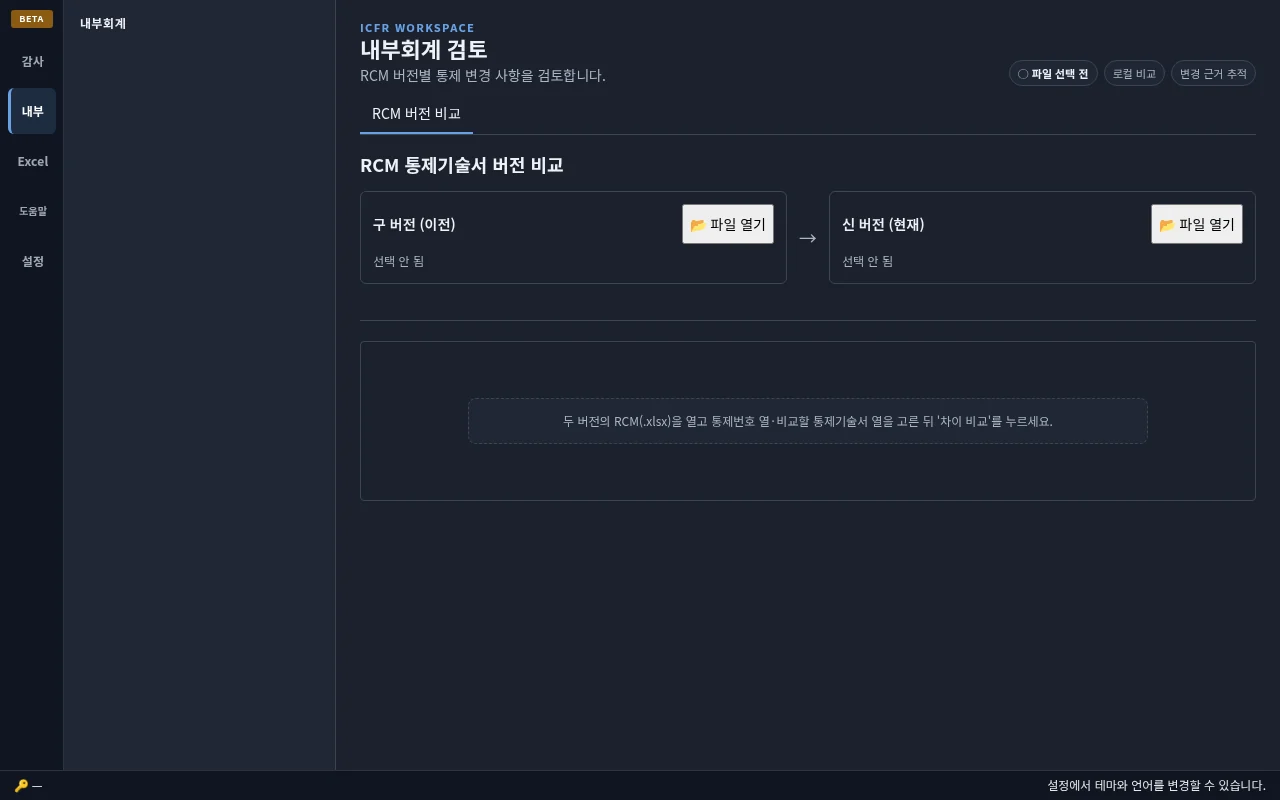
Control coverage is checked by mapping each control in RCM to account items and management assertions. Marks on both the transaction and balance, such as completeness, confirm the claim by specifying the axis of control (transaction process / account balance), and if there are multiple account candidates, the auditor chooses. Company-specific notation that is not included in the standard normalization can be reused for the next audit once confirmed with the company-specific account rule set (paid).
Design evaluation and operational evaluation are performed based on the connected controls. Evidence of operational evaluation is organized in the form of an audit report, and attribute samples are extracted from the population according to the sample number standard and created into a sample list sheet. It will be provided as a usix interconnection function.
09
Add frequently used functions to the Excel ribbon, such as going back to the previous cell, applying formatting, and sorting sheets. It is only installed to your current Windows user account and can be uninstalled from the same screen.
10
usix is the name of a suite of accounting automation products. Axon is a free local accounting analysis and preparation tool, and Soma is a paid accounting preparation product that creates RCM, reconciliation schedules, and report drafts with linked evidence step by step.
Soma is a separate paid product that builds on Axon's analysis and authoring output. It connects data organization, document reconciliation, RCMs, and workpaper authoring in one workflow. Pilots are in progress, and the scope and data-processing method for each workflow are explained before work begins.
Axon's primary analysis is performed on the user's computer. Features that require external connectivity, such as Soma, only work on tasks explicitly initiated by the user. The information to be transmitted and how it is processed will be clearly explained on the product screen and in the policy.
11
Change the theme (dark/light), font size (10~30px slider), and language (Korean/English). Everything is reflected immediately.
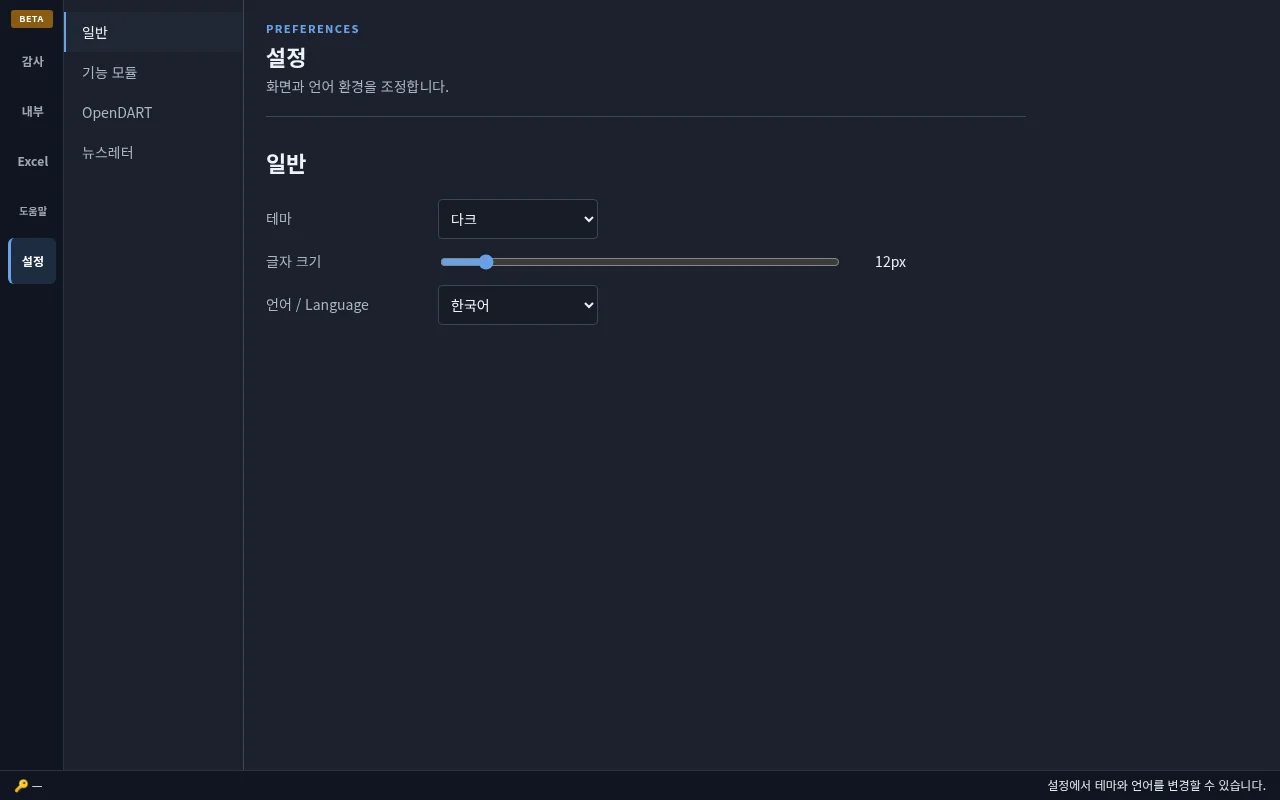
You can clean up the left function bar by turning off unused function modules. Even if you turn off the function, your data will be preserved. Detailed functions such as MUS Excel export/import are also set here.
You can save or delete OpenDART authentication keys. Subscribe to our newsletter and receive new versions and updates by email. Subscription is optional and must be completed by clicking the confirmation link in the email you received. You can cancel at any time thereafter.
If you run into any issues, you can send us feedback from the Help menu. After directly checking the transmission content with sensitive information hidden, select 'Send directly' or 'Send by email'. No information is sent automatically.
inquiry: yjw@propsol.co.kr